Michael R. H. Swanson, Ph. D.
Office: GHH 215
Hours M, W, F, 11:00 - 12:00
T: 2:00 - 3:00 and By Appointment
Phone: (254) 3230
Warning. There are a lot of statistics here. Don’t let that scare you off. Obviously no one is expected to memorize these–me included. But what I want to have you do is get a sense of the generalizations–both for the country as a whole, and for the various regions and metropolitan districts.
 Be aware of the variations, in terms of time, place, and/or in terms of dollars. For example, take a look at the chart Definition of Household Income Groups on p. 23. What has happened across time? What was the minimum income for the upper class in 1980. What is the minimum income now? What does that suggest to you?
In your journal, speculate a little about what this all means for American Society. How is the general community affected by the widening segregation by income
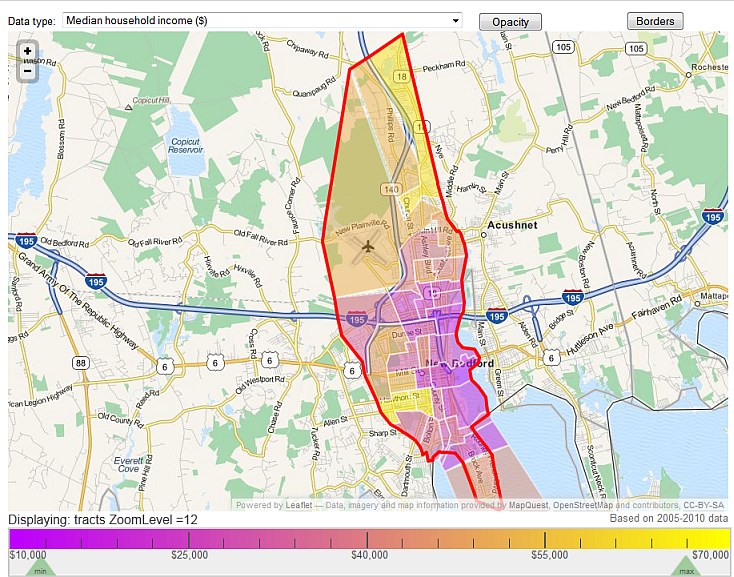
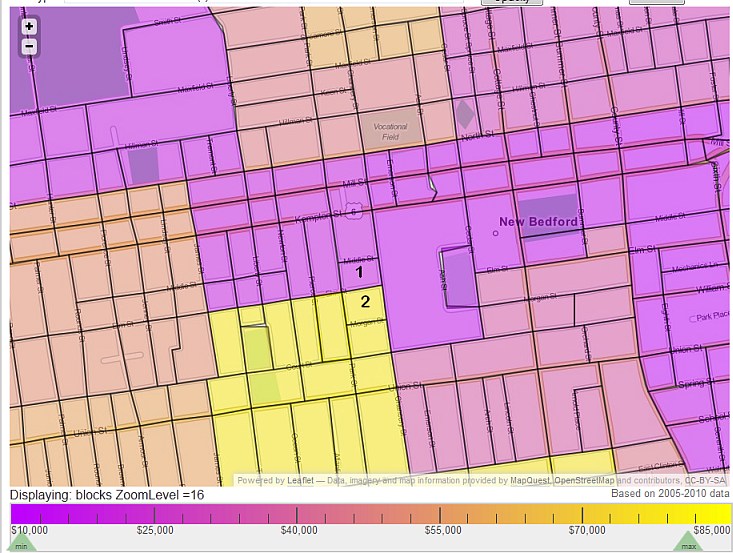
Click on either map to visit the City Data page for New Bedford Massachusetts. The scale below the maps represents median househoold income for each tract, the paler the color the higher the income. See if you can locate the two census blocks I've clicked upon. You'll be able to explore further data. A muse in your journal about your thoughts on this would be much appreciated.